A strain measurement for interlaboratory comparison of forces on the second stage in 6-8 multi-anvil pressure devices
K. Leinenweber (ASU)
C. Naseyowma (Honeywell)
T. Uchida (Argonne)
K. Righter, K. Domanik (U of A)
Abstract
As the number of multi-anvil laboratories around the world increases, and as new presses are installed at synchrotron beamlines and used for detailed in situ calibrations of cell assemblies, there is a developing need for comparison of multi-anvil performance between laboratories. In addition, it is of interest to know the relative frictional losses between multi-anvils of differing designs; particularly, between the Walker cylindrical module (Walker et al., ) and split modules such as split spheres (Kawai and Endo, ) and the new T-cup split design (Weidner, ). In particular, do any of the designs suffer from higher friction than others and need to be avoided for high-precision work? In this study, a steel cube has been equipped with a strain gauge and the amount of strain experienced by the cube in three different multi-anvil presses has been measured. Although this does not provide a quantitative measurement of the tonnage of each press, it does allow a sensitive qualitative comparison of the forces in the various multi-anvils. The new “T-cup” press recently installed at Argonne operates with nearly the same efficiency as the Walker-style multianvils installed at Arizona State University and at U of A, indicating that the mylar-lined sliding surfaces in the Walker module do not measurably degrade the pressure efficiency relative to the T-cup which lacks these surfaces. However, even the T-cup design has some sliding in the guideblocks, and it may be profitable in the future to compare these results to those in a split-sphere device, which is the only design that is fundamentally free of sliding, and experiences only elastic deformation of the guideblocks and ram.
Introduction
Figure: comparing 3 tooling designs.
Experimental
A steel cube (*can the hardness be known? Check old records) that was originally used as a blank for initial testing of multianvils, was surface-ground to 50.8 mm (2.00 inches) on each face (corresponding to twice the edge length of the 25.4 mm carbide cubes used in some laboratories). The cube was measured relative to a gauge block, and the parallelism of each pair of opposing faces was measured and found to be always within 3 microns, while the heights in the 3 directions were found to be within 8 microns of each other. (*can you measure on a Universal stage for cubicity?).
A flat bevel was ground into the center of one edge of the cube (Fig. 2), and a uniaxial strain gage (National Instruments 350 ohm uniaxial, 125 mil gage length) was placed with the gage direction parallel to the cube edge. The surface was prepared for the gage by sandblasting, then a cleaner, primer and glue were applied (National Instruments part ) and the gauge was glued and then cured at 270 F for 1.5 hours. This process resulted in an instantaneous and highly reversible strain measurement; the runs reversed to within a few microstrain in every case. Earlier tests with cyanoacrylate glue showed less reversibility and a slow drift in strain measurements after each pressure change. The strain gage was read using a National Instruments P3500 strain indicator set to a gage factor of 2.135.
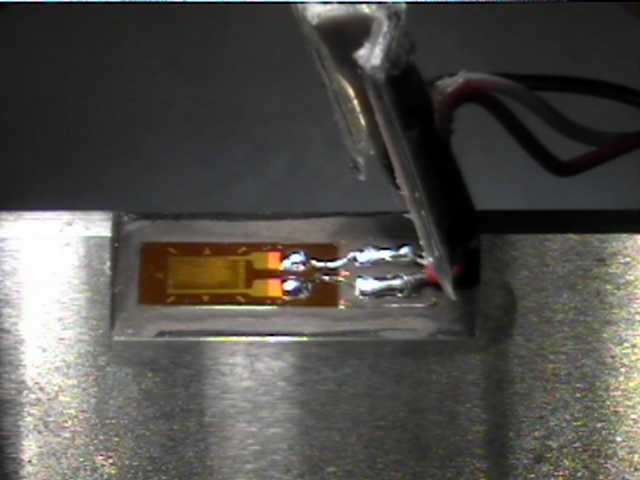 Figure:
Strain gauge mounted on a bevel in the edge of the steel cube.
Figure:
Strain gauge mounted on a bevel in the edge of the steel cube.
The cube surfaces were covered with square pads of G-10 fiberglass-impregnated epoxy resin, * mm (.015 inches) thick and * mm (1 7/8 inches) square, of the type typically used in multianvil runs. The cube was placed within the multianvil apparatus and subjected to compression similar to that experienced by a multianvil cube-assembly. Oil pressure was applied to the hydraulic ram, and the strain in the steel cube was recorded at regular intervals during both pressure increase (upstroke) and pressure release. The nominal ram force was calculated from the oil pressure and the ram area of each press (F = P*A), in order to allow comparison between presses.
The ram diameters for the presses studied here are: * m (17 inches) for the press at Argonne National Laboratories (the force was read directly from the electronic gauge provided by the manufacturer, but was also double-checked against the oil pressure and ram area), * m (17 inches) for the press at Arizona State University (the force was read from a Heise pressure gauge calibrated at the factory) and * m (* inches) for the press at University of Arizona.
Results
Comparitive curves of strain versus normalized force are shown in Figure 3. The first notable feature of the curves is the very different initial behavior at lower forces. In some cases, extension of the strain gauge is even observed at the early stages of loading. This is related to the alignment of the module relative to the ram, the centering of upper guideblocks relative to lower guideblocks, and the cubicity of the cavity within the module; misalignment can result in either excess extension or excess compression of the gauge, depending on its location relative to the misaligned faces of the cubic cavity. The resulting differences in the curves amounts to up to 500 microstrain for the three presses studied here.
As force increases beyond 100 tons, the curves become subparallel to each other. The degree of parallelism is the best representation of the comparison between the two presses that can be obtained with this method. Figure 4 is a plot of the slope of the data curves, measured using a weighted 5-point approximation.
Discussion